AI Cost Analytics Dashboard
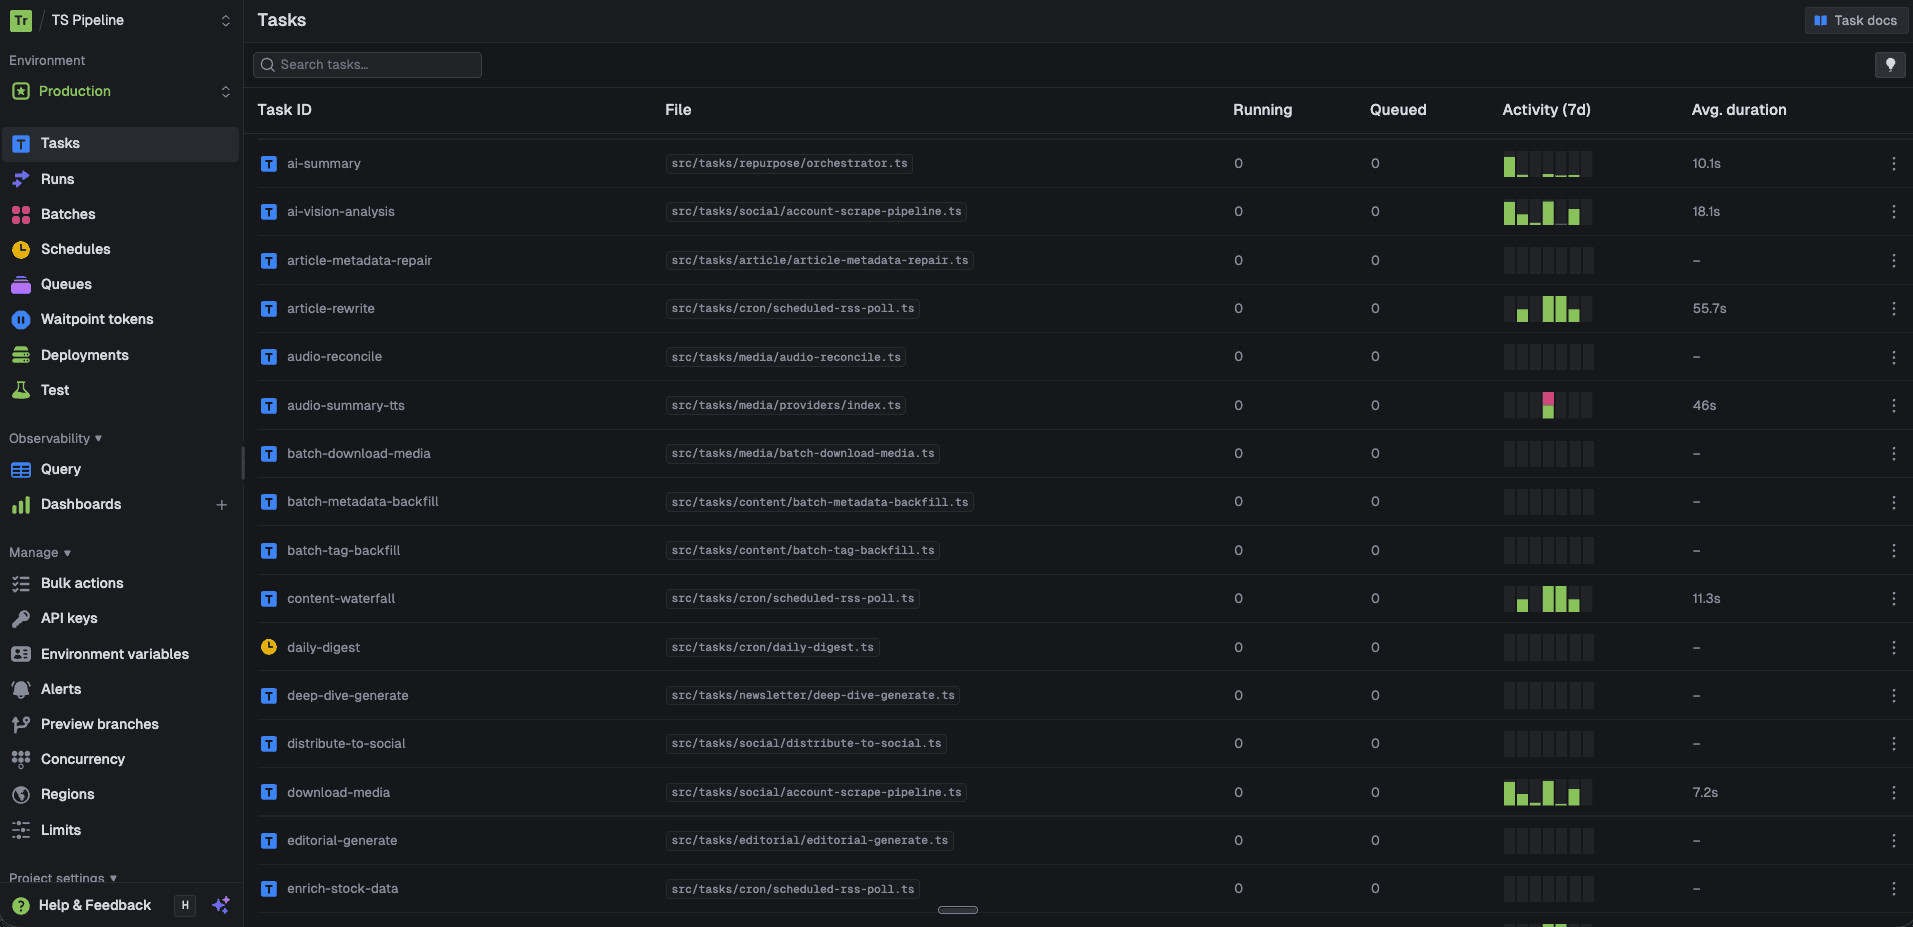
A production attribution layer that traces every AI generation (text, image, audio, video) back to the content it produced, the model that created it, what it cost, and how it performed. Built on a structured generations ledger across Gemini, ElevenLabs, Replicate, and OpenAI.
Performance Tab
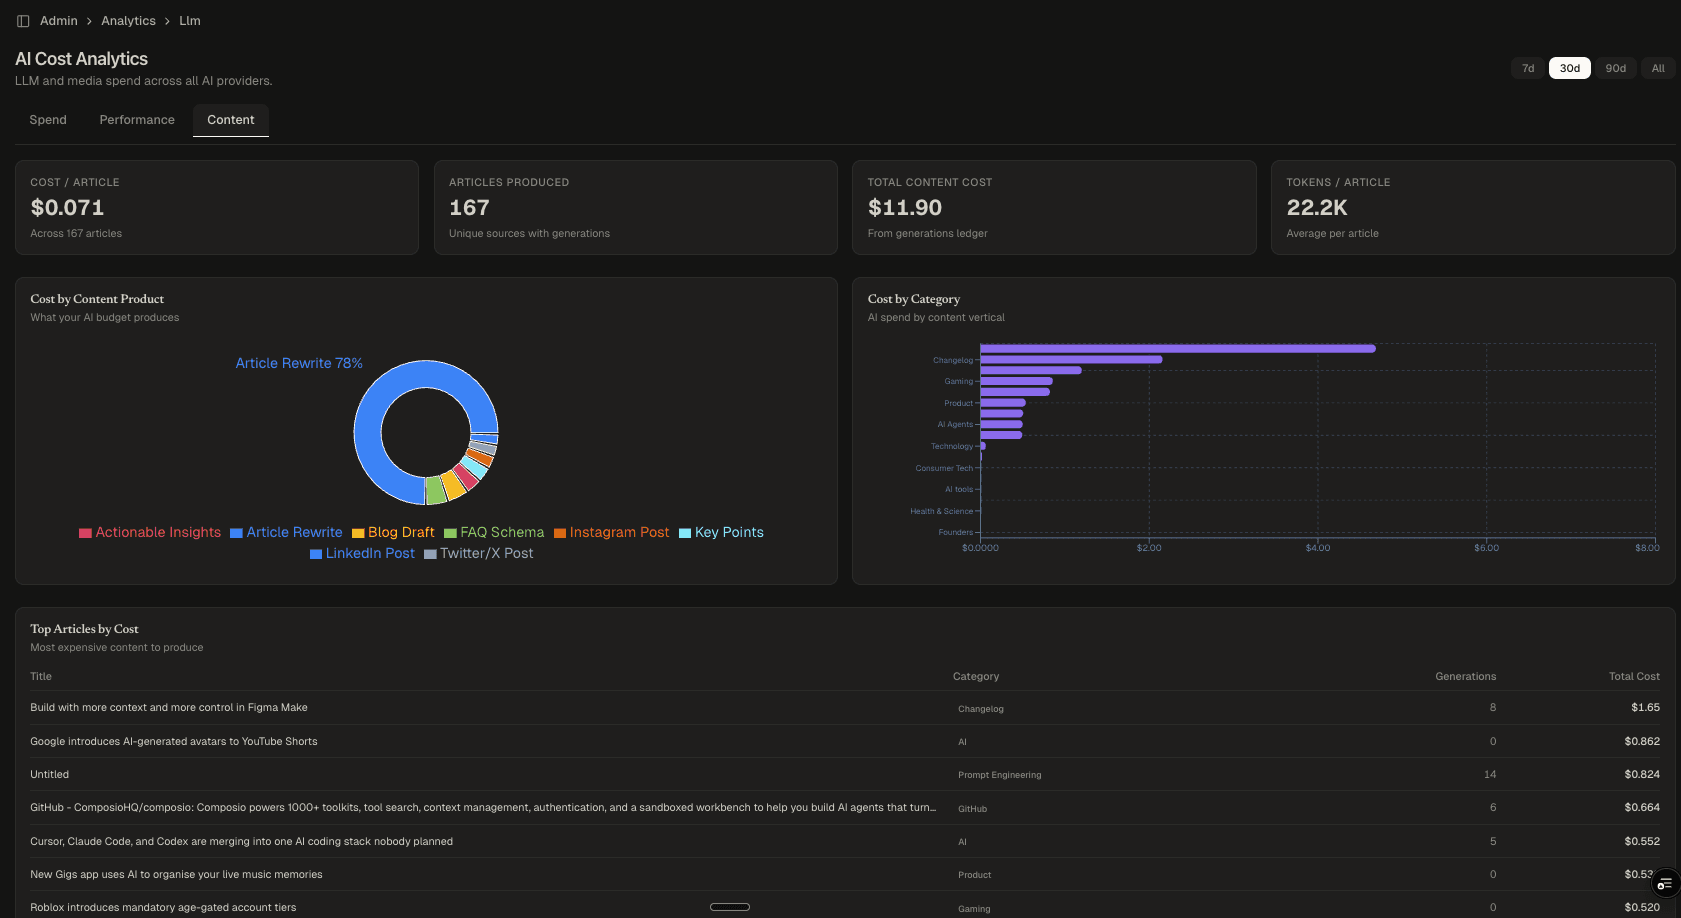
Content Economics
Why This Exists
When you run AI across dozens of tasks (article rewrites, image generation, audio synthesis, social captions, newsletter content), you need more than logs. You need attribution. Every generation should answer: what model produced this, what content did it feed into, what did it cost, and how long did it take?
This dashboard is the answer. It sits on top of a generations ledger, a structured record for every AI call in the system, and gives operational, financial, and editorial visibility into the entire pipeline.
The Attribution Layer
The foundation is a simple principle: every AI generation gets a record. Every single call writes a row with:
- What: The generation type (article rewrite, image brief, FAQ schema, social caption, audio narration)
- Where: Which model and provider produced it (Gemini, ElevenLabs, Replicate, OpenAI)
- When: Timestamp, latency, and execution context
- Why: The source article, content category, and pipeline step that triggered it
This creates a complete chain of custody from raw source material → AI generation → published content. When an article goes live, you can trace every generation that contributed to it: the classification, the research enrichment, the rewrite, the image, the social posts. You know exactly what each step cost.
Three Lenses
The dashboard surfaces this data through three tabs:
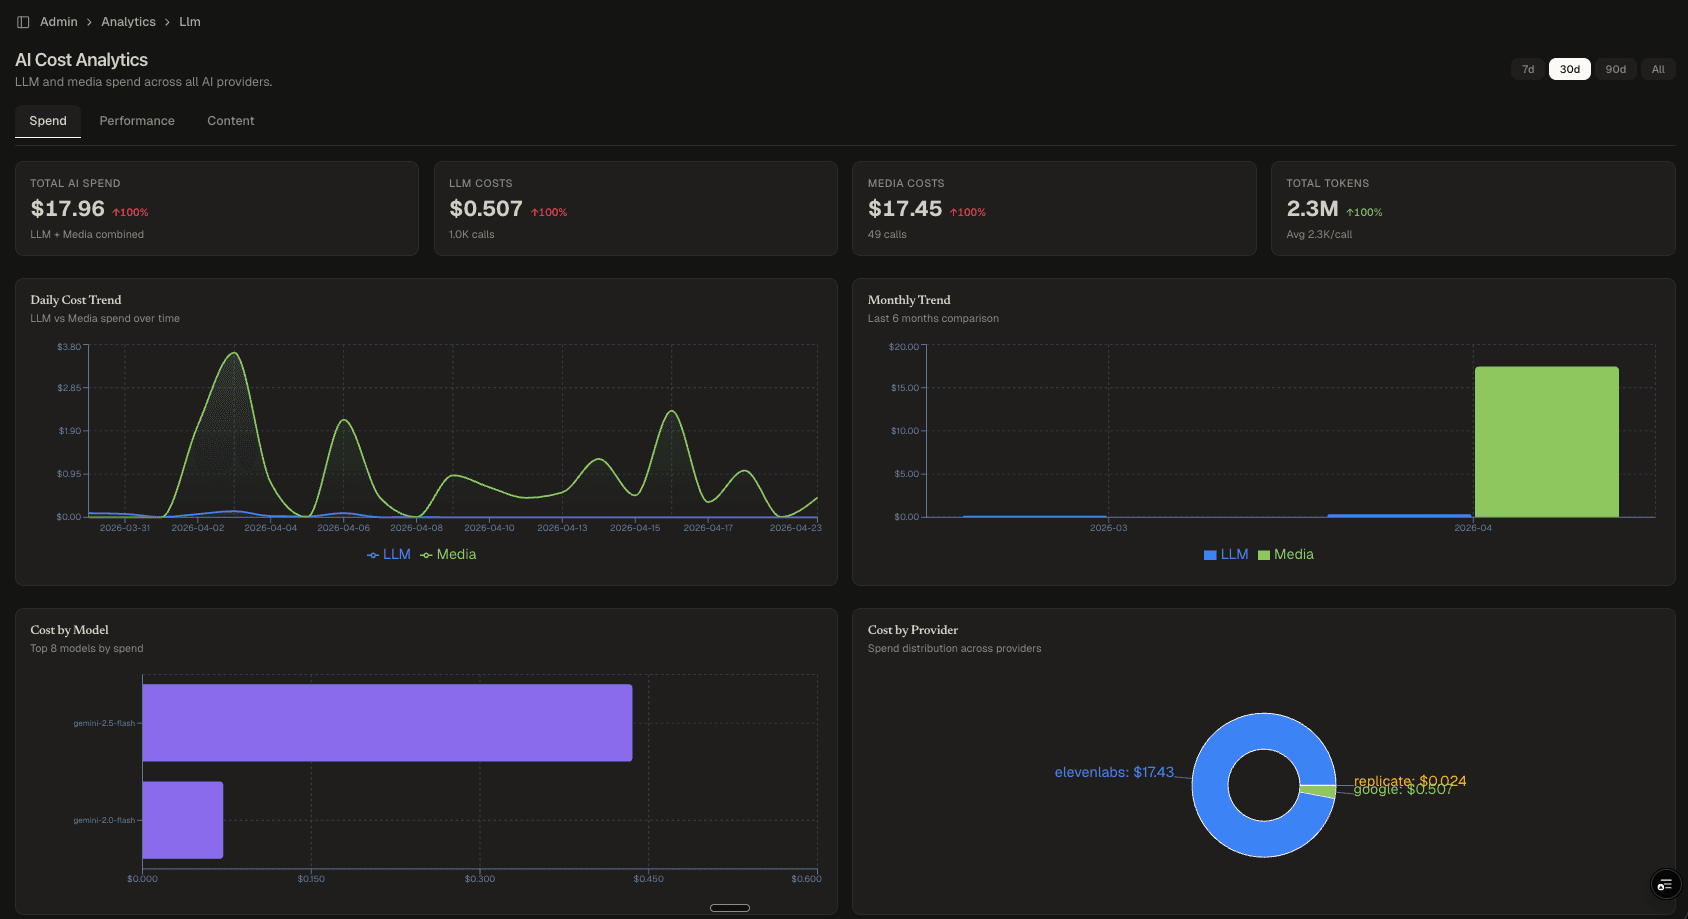
- Spend: Total AI spend (LLM + media), daily cost trends, cost by model, cost by provider. Tracks budget burn and identifies which providers drive the most spend.
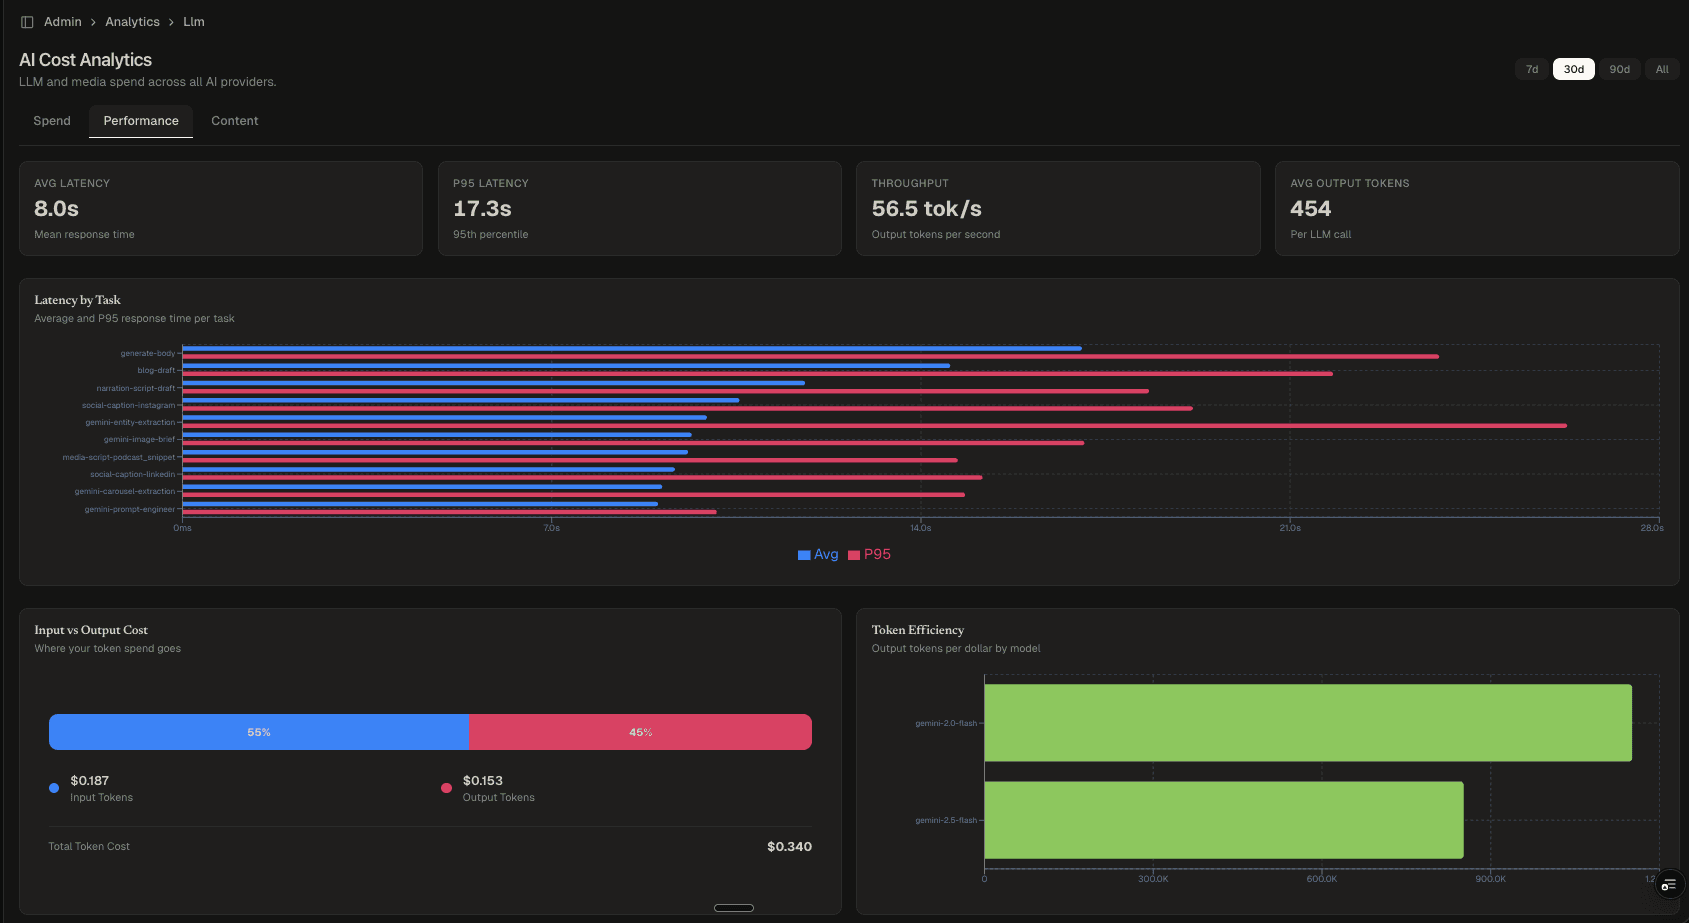
- Performance: Average and P95 latency per task, throughput (tokens/second), input vs. output cost ratio, token efficiency by model. Identifies slow tasks and inefficient models before they become bottlenecks.
- Content: Per-article cost, total content cost, tokens per article, cost by content product, cost by editorial category. Connects AI spend to business output and the unit economics of content production.
Engineering Decisions
- Ledger over sampling: Full attribution requires full data. Every generation is recorded, giving exact cost-per-article instead of projections.
- Provider-agnostic schema: The generations table normalizes across all providers. The dashboard doesn't care if the output came from Gemini or ElevenLabs. The attribution chain is the same.
- Content-joined economics: The Content tab joins generations to articles, giving a true unit economics view. An article that costs $0.07 to produce tells a different story than one that costs $1.65.
- Time-windowed queries: 7d, 30d, 90d, and all-time windows with optimized aggregations for fast rendering at scale.
Project stack

TypeScript
Typed end to end
Next.js
App Router + RSC

Supabase
Postgres, auth, storage

Langfuse
LLM tracing + evals

Vercel
Deploys + edge